Authors
Md. Ashhab Sadiq, Showmitra Kumar Sarkar, Saima Sekander Raisa
Aim
To evaluate the spatiotemporal characteristics of meteorological drought in northern Bangladesh using multi-source remote sensing data and machine learning methods.
Summary
This study investigates meteorological drought in northern Bangladesh (2010–2019) through the integration of remote sensing indices and machine learning. Using 4 types of Standardized Precipitation Index (SPI) as the primary drought indicator, 7 satellite-derived variables were analyzed with a Random Forest model to capture spatial and temporal drought patterns. The approach provides a comprehensive framework for understanding regional drought dynamics.
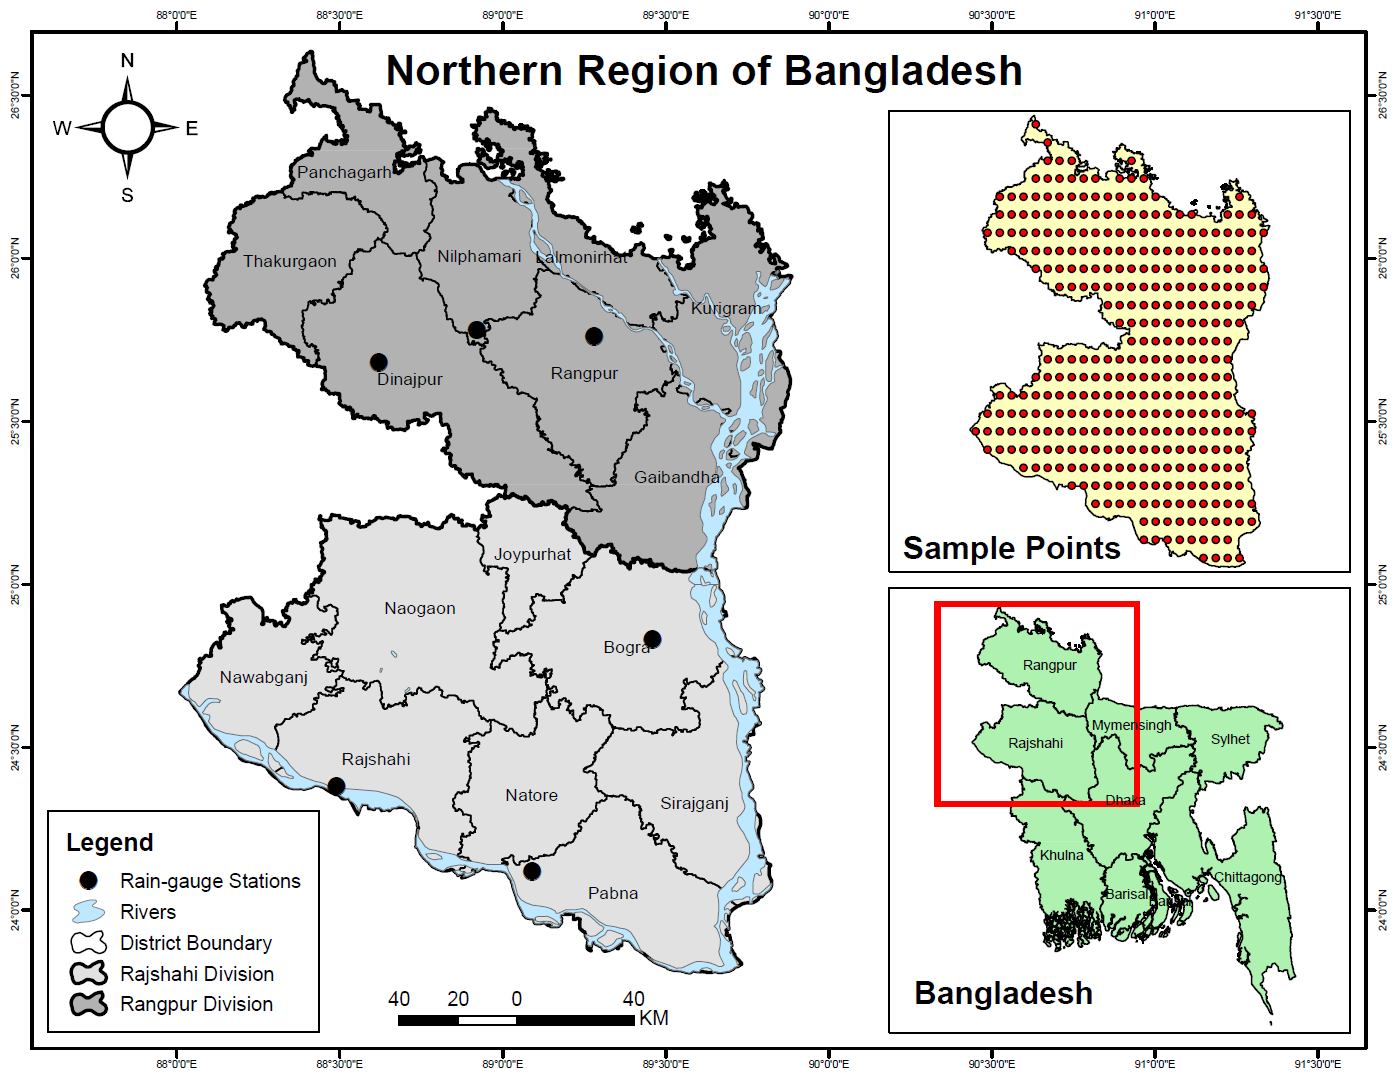
Study Area
The northern region of Bangladesh, covering Rajshahi and Rangpur divisions (16 districts, total area 34,359 sq. km), was selected as the study area. Bounded by the Padma River to the south, Jamuna River to the east, and the Indian border to the west, it has a mean elevation of approximately 30 m. The region has a monsoon climate with annual rainfall of 1400–1550 mm and is predominantly agricultural (nearly 80% of land). Groundwater is the primary source of irrigation during the dry season. Geographically, it includes the Barind Tract, Himalayan piedmont plains, and alluvial lowlands.
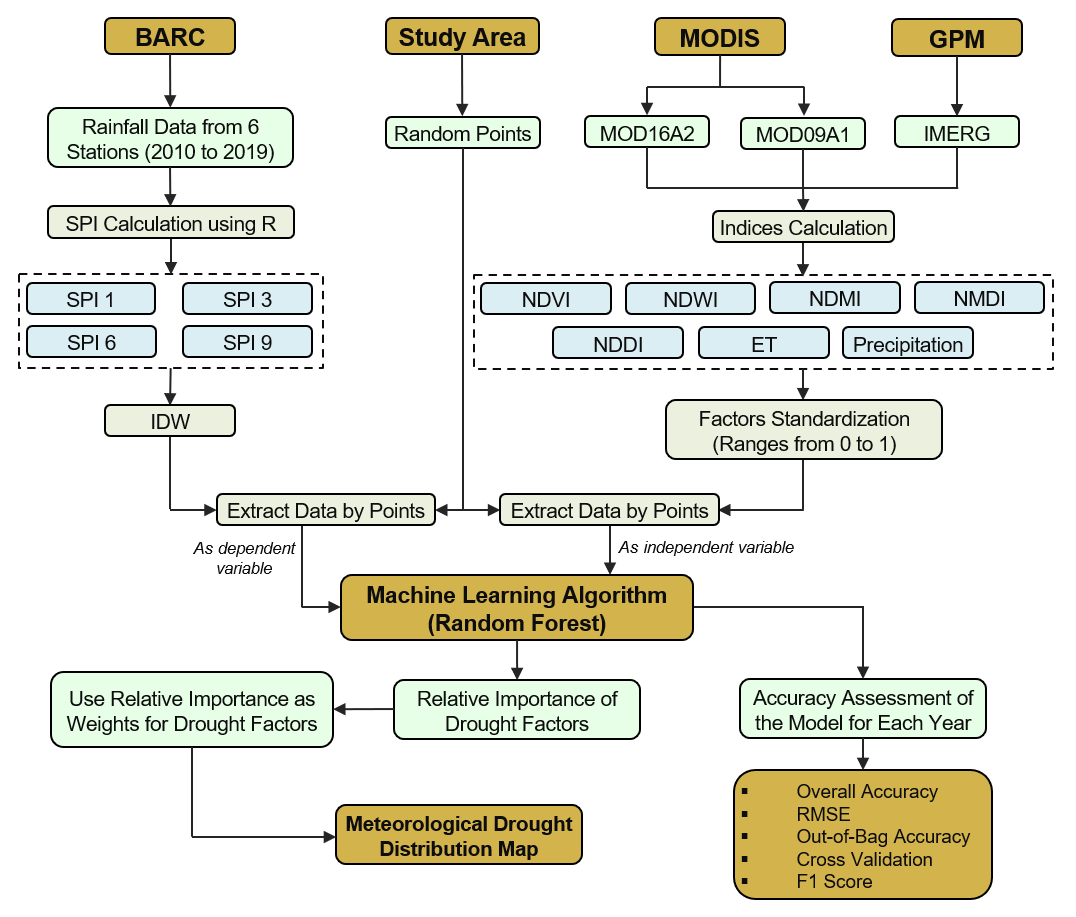
Methodology
- Data Preparation: Derived seven drought-related indices (NDVI, NDWI, NDMI, NDDI, NMDI, ET, and Precipitation) from MODIS and IMERG imagery using Google Earth Engine (GEE).
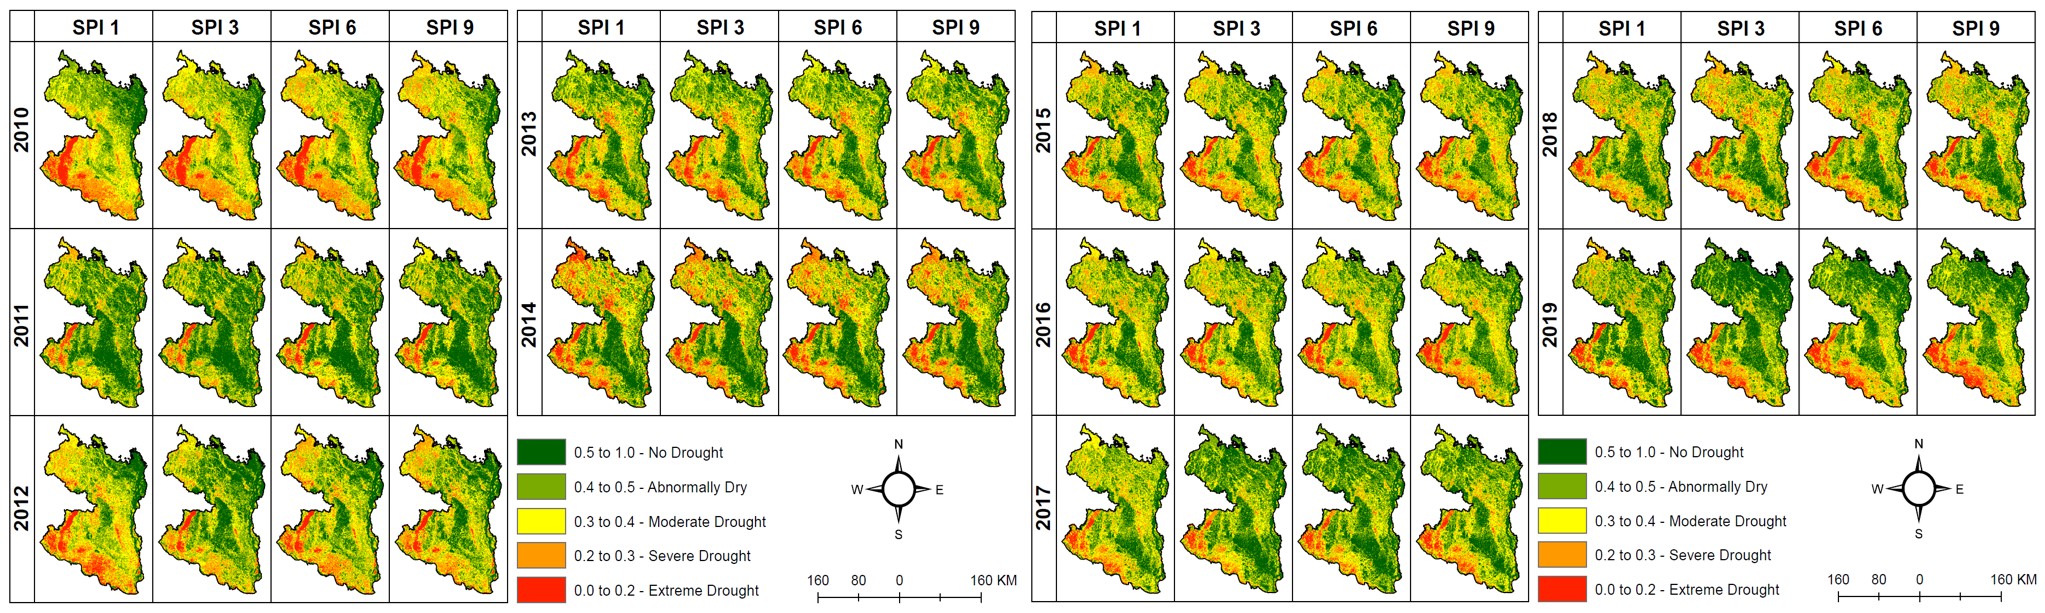
- Reference Indicator: Computed the Standardized Precipitation Index (SPI) from station-based rainfall data for 1-, 3-, 6-, and 9-month timescales using R programming in RStudio.
- Model Development: Built a Random Forest model in Python (Spyder IDE) to evaluate variable importance and predict drought intensity at different time scales (1-, 3-, 6-, and 9-month SPIs).
- Spatial Mapping: Weighted indices were integrated in ArcMap using raster analysis to generate annual drought distribution maps (2010–2019).
- Validation: Assessed model performance in Python, using metrics such as accuracy, RMSE, F1-score, and cross-validation.
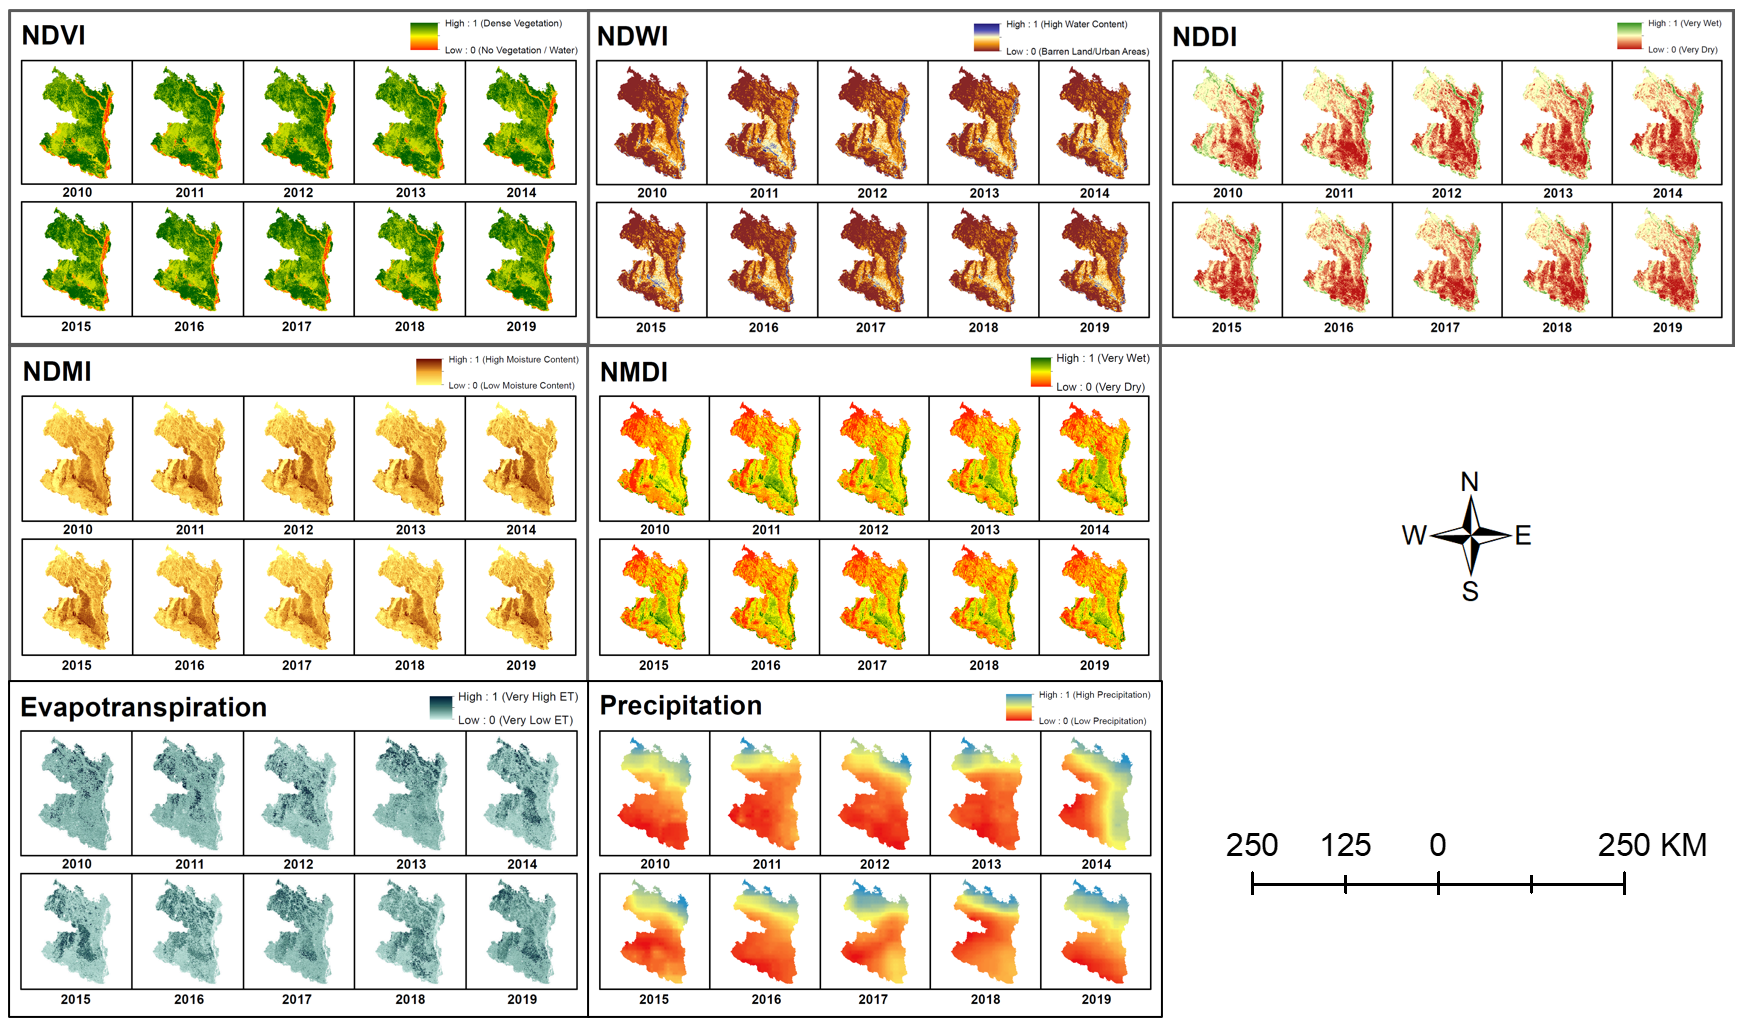
Remote Sensing Indices
Seven remote sensing indices were derived from MODIS and IMERG imagery to represent vegetation, moisture, and climatic conditions.
- NDVI – Indicates vegetation greenness and photosynthetic activity.
- NDWI – Measures surface water and soil moisture conditions.
- NDMI – Reflects vegetation and canopy moisture content.
- NDDI – Combines NDVI and NDWI to assess drought severity.
- NMDI – Detects vegetation and soil dryness using multiple spectral bands.
- ET – Represents surface heat flux and water loss.
- Precipitation – Shows rainfall distribution across time and space.
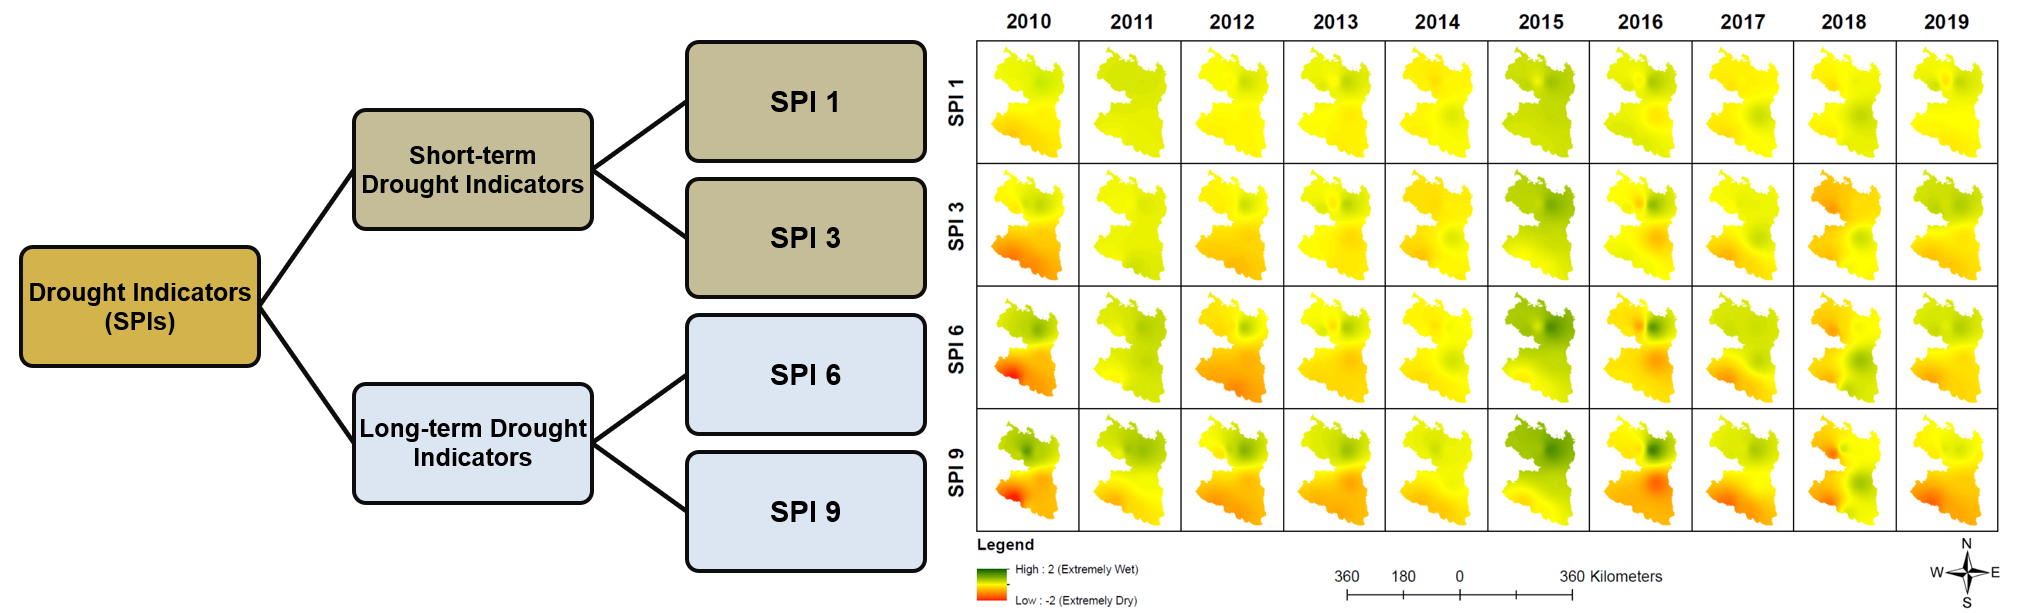
Standardized Precipitation Index (SPI)
- SPIs values were calculated from station-based rainfall data (2010–2019) using RStudio (SPEI package).
- Spatial interpolation of SPI values was performed in ArcMap using the IDW method.
- SPI maps served as the drought indicator for training and validating the Random Forest model.
Key Findings
- The Random Forest model achieved 81–95% accuracy.
- Precipitation was the dominant drought driver, contributing 28.32% to short-term and 26.78% to long-term drought variations.
- Apart from Precipitation, short-term droughts were influenced mainly by ET (13.57%) and NDWI (12.13%), while long-term droughts were governed by NMDI (14.27%) and NDVI (12.87%).
- The Rajshahi Division, especially the Barind Tract, faced the most frequent severe to extreme droughts during 2010–2019.
- On average, 5% of the area experienced extreme droughts and over 12% endured severe droughts.
- Long-term SPI indices (SPI-6, SPI-9) captured a higher frequency of extreme events than short-term SPIs, revealing the cumulative effect of rainfall deficits.